
One of the best tools to share price risks between buyers and suppliers is index-linked pricing. Most procurement professionals have heard of and used commodity indices to tie pricing to the wider market, but in short they are a third-party tracking tool for commodity pricing. The consumer price index is a common and popular index, but there are also more specific commodity indices that can be used by supply chains and procurement teams in analyzing and setting supplier costs. We’ve talked briefly about commodity indices as a data-driven negotiation tool, and in today’s article will discuss how to use a couple of common indices, strengths of the two most common indices, and how to structure indices in a contract.
How to Use Commodity Indices
My two favorite commodity indices are the Bureau of Labor Statistics and the London Metals Exchange, so that is where this article will focus. There are certainly others, but these two are available at no cost and are fairly widely used. If your business or suppliers use others, then those are strong alternatives.
The Bureau of Labor Statistics index (BLS) is a U.S. Government index using data reported to the U.S. Government and covering a wide variety of commodities and industries. To use the BLS for data on a specific commodity, follow the below steps.
- Navigate to https://data.bls.gov/PDQWeb/pc
- Start typing your search in the RIGHT hand box, #2
- Select your industry
- Then go back to ”Select an Industry” and type in the number of your Products until you have only one option in box #1
- Click “Add to selection”
- Click “Get Data”

- On the resulting page that loads, change the date range to the one for your contract, or since the contract was last bid (typically 3-5 years).
- Check the “include graphs” box
- Click “GO”

Note you can now download the data as an Excel file to be made into charts and graphs or otherwise manipulated. We will discuss some strengths (and weaknesses) of the BLS later, but it is a very good way to quickly find how a given commodity is trending. Consider repeating this process for commodities similar to the one you are seeking, such as different forms of steel or similar services to the one you are contracting. The comparison of similar commodities can help you determine general trends and prepare for any supplier counterargument.
Using the London Metals Exchange index (LME) is similar, but a little more straightforward.
- Navigate to https://www.lme.com/
- Select “Metals”
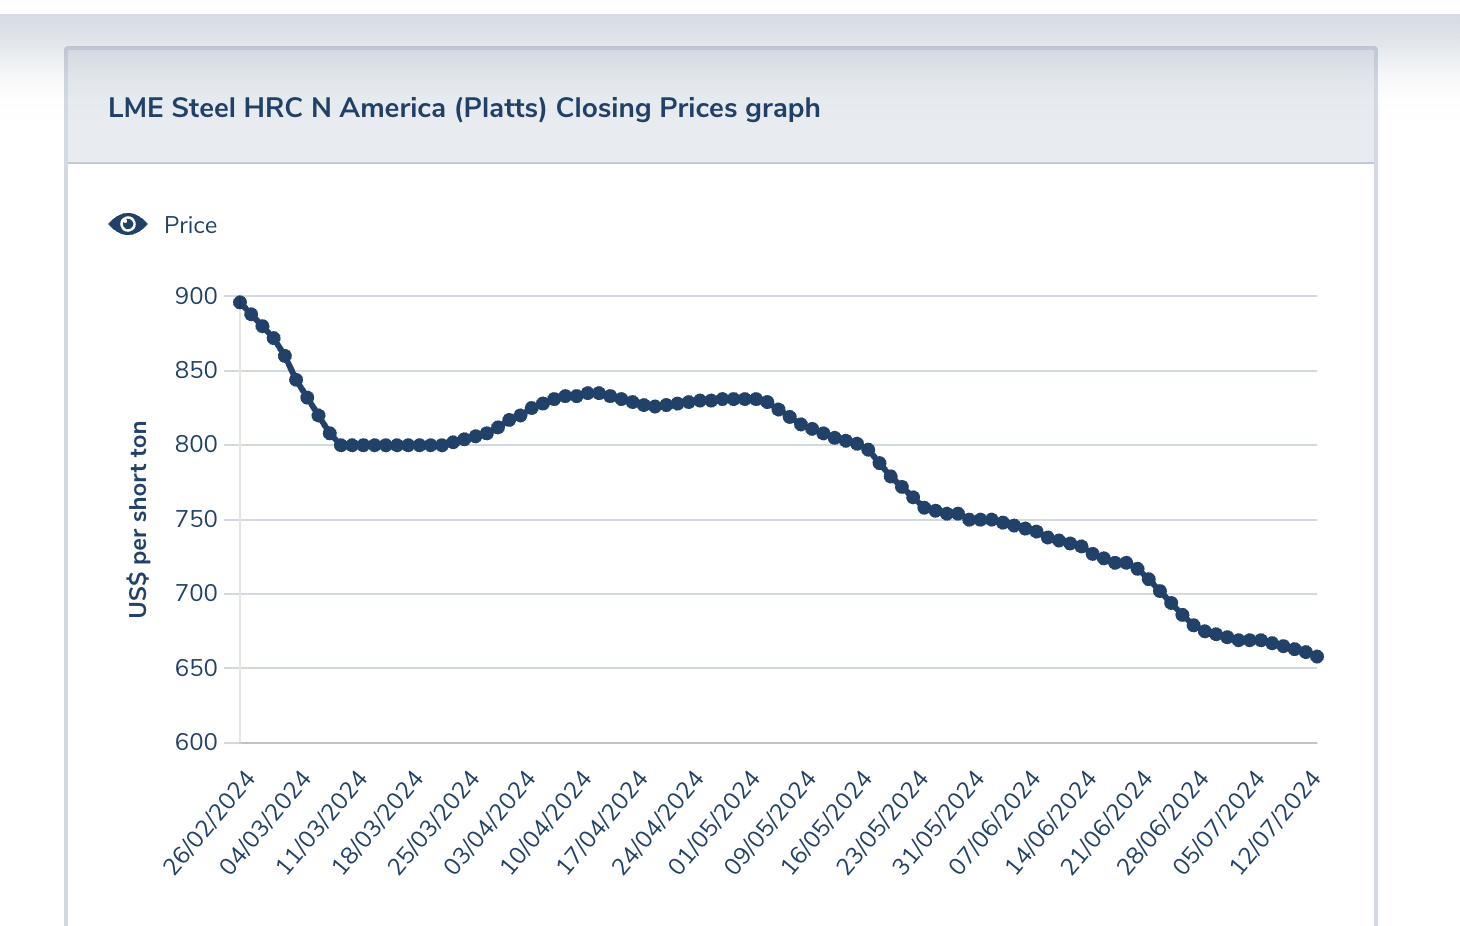
- Select desired group and type (In this example, North American hot-rolled coil steel)

- Scroll down on the page and select “Price graph”
- Enter desired dates, note that unpaid subscriptions have a shorter timeframe available

Unlike the BLS, the LME is very specific to metals and similar near-raw materials. It covers non-ferrous metals (aluminum, copper, zinc, nickel and lead), ferrous metals (steel scrap, hot-rolled coil/HRC, and rebar), and EV materials (lithium hydroxide, cobalt, and molybdenum). The data is harder to move into Excel or otherwise manipulate, but the indices still provide the needed information for commodity pricing.
Index Strengths
Each of the indices discussed here have different strengths and weaknesses, as is true with all things. Let’s explore some of those strengths and limitations more directly.
The BLS has a very broad set of categories, from medium-duty trucks to IT software development services. Some of those indices have data going back to the 1980s or before, and the data is accessible and free of charge. The data is also very objective, as it is gathered by a government agency and less swayed by an index paid for by private donors or investors. It is easy to export to Excel for manipulation (say what you like of Excel, it’s easy and people have access to it), and is presented cleanly.
The drawbacks of the BLS are also fundamental to its identity as a data source gathered by the U.S. government. The data is delayed, sometimes for up to three months. At the speed business moves, this delay can be critical. It is also very U.S.-centric, not representing how indices are moving in Asia, Europe or Africa. While the general trends in pricing in the U.S. typically mimic those elsewhere, there are certainly exceptions based on global economic forces and political environments (such as when another country passes a major environmental bill). While the number of categories in BLS is a strength, it can also make it tricky to find the right category or commodity and can lead to disagreements between buyer and supplier as to which category is governing costs.
Lastly, the BLS is a “pure” index in that it does not use commodity pricing. The commodity value was set at 100 at a point in time (labeled “Base Date” on the data page in format YYYYMM), and has moved in a relative fashion from there. Most hover between 100 and 200 (and the BLS will sometimes adjust the base date to keep them there), and increase over time. Note that a fun one to check out is laptops, and it’s especially fun to reset the graph to start back in the 1990s. While the non-priced approach is still helpful, it is most useful if your business already has a previous price paid for something to compare to supplier quotes. For an entirely new category, a buyer will need to find another price benchmark to effectively use the index.
Unlike the BLS, the LME does use actual prices for its commodities. This can be very useful in seeing market trends and even estimating project costs (depending on your industry). The data is also very up-to-date, sometimes within 24 hours. Unlike the BLS, the data comes from all over the globe and for some commodities the user can select an area of focus. It is also a common index for suppliers, as suppliers are closer to the raw material stages of the supply chain and the LME is a well-recognized authority in this space.
The largest limitation of the LME is the short list of categories. It mostly covers raw materials or steel shapes that are nearly raw, and doesn’t venture far beyond metals. There are also some features behind a paywall for the LME, which might be tricky for small businesses or tight budgets. While the paywall is not steep, it adds up quickly for a whole team.
Index Contract Structures
After selecting a relevant index and agreeing to it with a supplier, the next best step is to solidify it in the contract. I built a short example of calculating commodity indices below, first with the spreadsheet showing results and then the same spreadsheet showing the formulas.


At the very least, you need the percentage of the price that is subject to change based on indices. In this case, I used indexes from January 2020 and then June/July 2024 (this is where the data lag for BLS shows up), and you can see that the steel index actually went down in that time period. Note that we could have also added a labor index and adjusted that component of the price using the same formulas as the material pricing.
Now that you have your formulas set, you can codify the price index in the contract. Ensure the percentages and the index to be used are in the pricing schedule or contract documents, and the date the pricing “starts,” or the first index to be used. The last major decisions are the frequency for updating pricing based on the index, whether or not there will be a “buffer zone” around the price, and timing for price changes.
Frequency depends most on the volatility of the chosen indices and the appetite for risk. Longer times between changing the price lead to greater supplier risk, where the supplier may have to carry a higher price for longer before the buyer’s price rises. However, frequent price changes can carry heavy administrative costs to update buyer and supplier systems or even open purchase orders. Don’t change your price more frequently than quarterly, and try for twice a year or annually if possible.
Another way to combat administrative costs is to establish a buffer zone around the price. This means if the index would cause the price to rise or fall less than a set percentage (i.e. less than 5%), the price will not change. Unless volumes are very high, chances are good that small percentage changes cost the parties more in administrative fees than is gained in the index-linking. This also keeps the pricing such that it can move in volatile markets, but be stable in more stable markets. Often markets are less volatile or the materials cost is a smaller percentage of the total cost than buyers and suppliers assume.
The last price index item to codify in an agreement is the timing of a change. How much warning does a supplier need to give ahead of regular price changes? Who is doing the index lookups and calculations, and who is checking that work? Do existing POs stay at the same price, or follow the new one? Make these decisions with your supplier partner and then get them in writing before completing the contract. Best practice for the commodities I have worked with has been to require the supplier to present their price changes based on indices 30 days before the change is to take place (along with their math), and then all POs cut before the price change takes effect will be at the previous price. Any POs cut during this time period have to be at or inside lead time, to prevent the buyer from trying to place a bunch of POs at once for a “savings” that instead simply moves the increased material costs onto the supplier. That practice may have short term gains, but erodes the supplier relationship.
Now that we’ve talked about commodity indices and how to use them, how will you incorporate them into your supply chain and procurement efforts? If you’d like to chat more about your specific application or nuance (fuel hedging, anyone?), schedule a meeting on my calendar to chat!